
A typical business data analysis project can be organized into four phases and eleven steps, with iteration between phases as the questions and available data evolve.
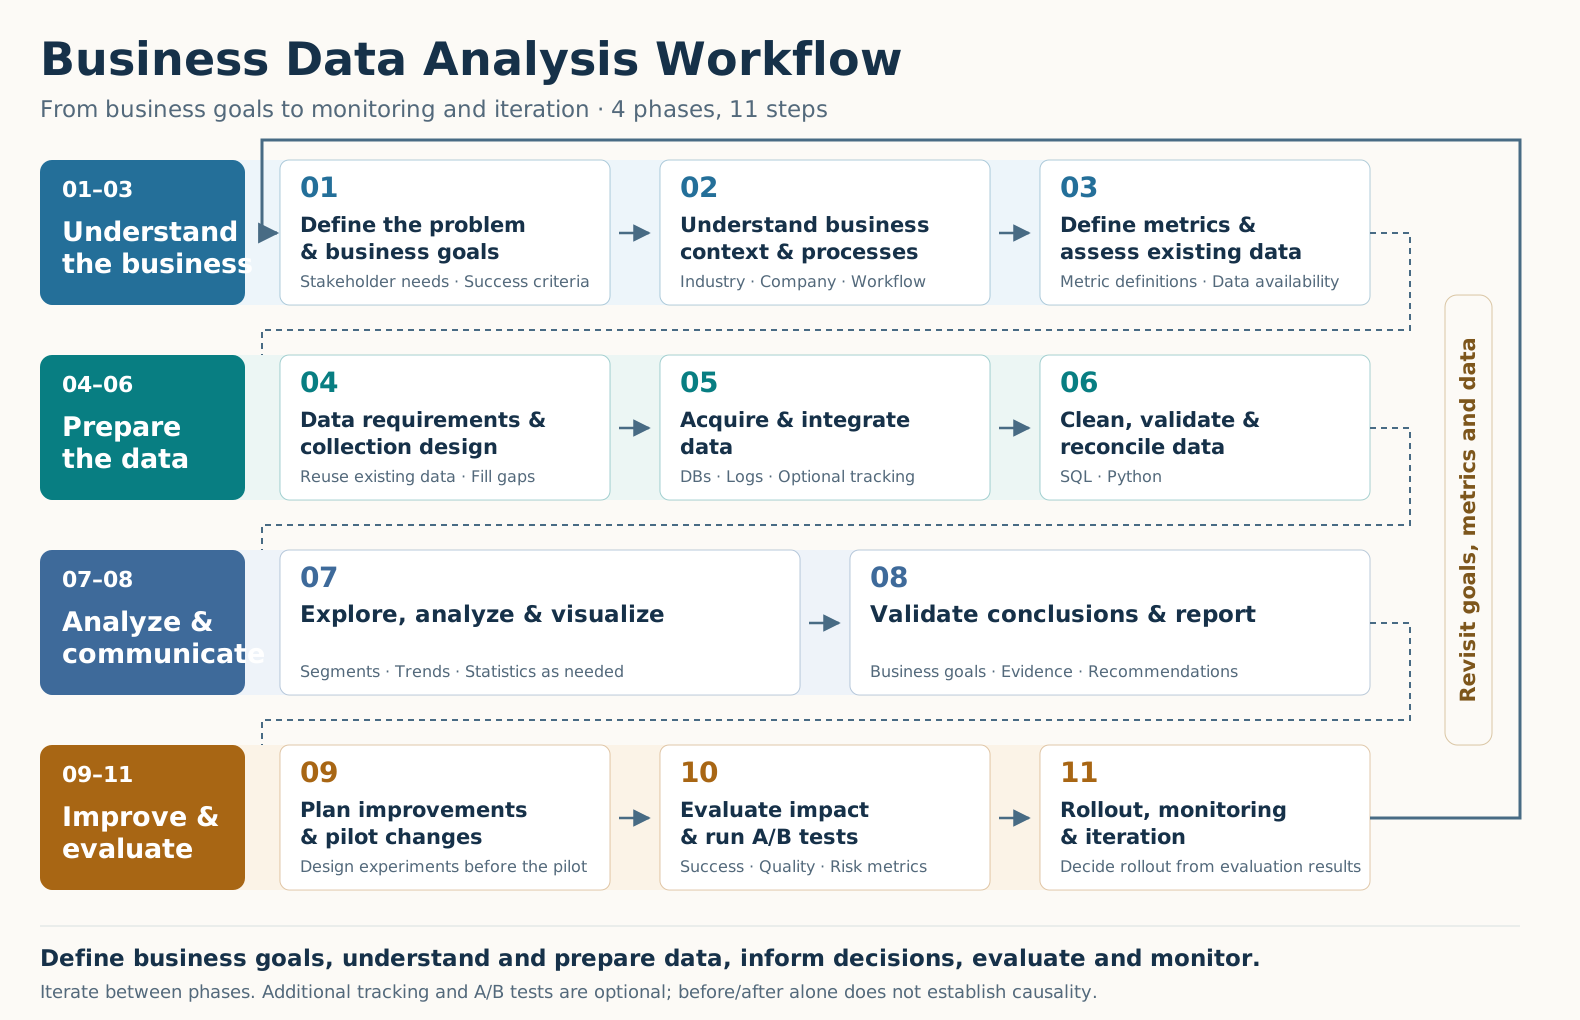
Open the full workflow diagram
Four phases
- Understand the business (①–③): Define the problem and success criteria, understand the business context, agree on metric definitions, and assess existing data.
- Prepare the data (④–⑥): Reuse business data and add collection where needed; integrate, clean, validate, and reconcile records with SQL/Python.
- Analyze and communicate (⑦–⑧): Explore segments and trends, use statistical methods where appropriate, and visualize and communicate validated conclusions with tools such as Tableau/BI.
- Improve and evaluate (⑨–⑪): Design changes and evaluation methods before piloting, run A/B tests where suitable, decide rollout from the results, and continue monitoring and iterating.
References: CRISP-DM · NIST exploratory data analysis · Microsoft experimentation practices. This is a simplified overview adapted to business analytics.
Enjoy this article?
If you found it helpful, consider supporting my work.